BRITAIN’S INFLATION REPRIEVE: HOW THE UK HELD THE LINE AT 2.8%—AND WHY THE RELIEF MAY BE TEMPORARY
As May Inflation Data Beats Expectations and The Bank of England Prepares To Hold Interest Rates Steady, An Fragile Peace Masks Growing Risks From Energy Price Pressures, Geopolitical Uncertainty, and A Global Economic Slowdown That Threatens Growth
A MOMENT OF RELIEF IN AN UNCERTAIN ECONOMY
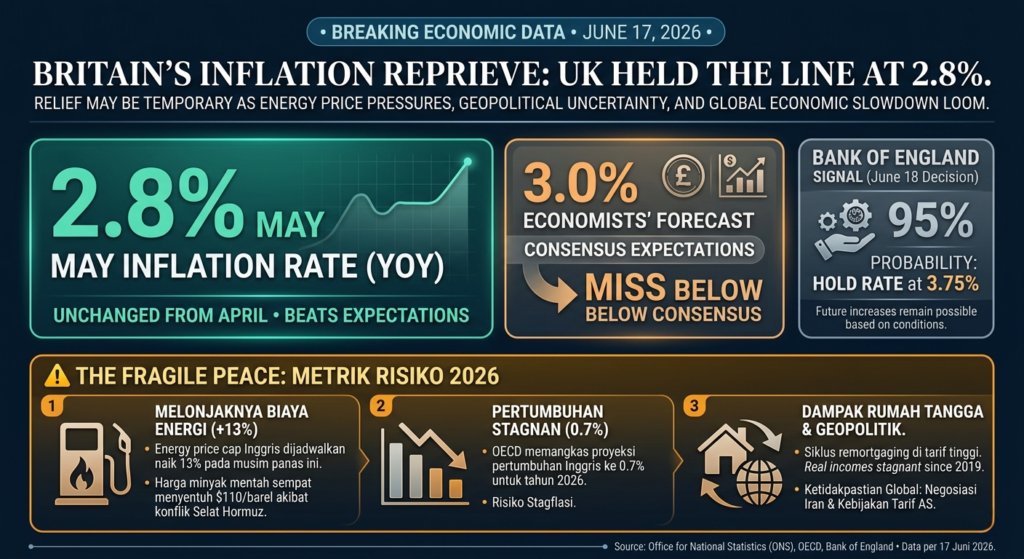
On Wednesday, June 17, 2026, Britain received a small gift: inflation data that defied pessimistic expectations and provided temporary respite from the economic pressures that have haunted the UK throughout the first half of 2026.
The Office for National Statistics released May 2026 Consumer Price Index data showing that UK inflation held steady at 2.8% year-over-year—unchanged from April’s reading and significantly below the consensus forecast of 3.0% that economists and markets had been pricing in.
For the Bank of England’s Monetary Policy Committee, which faces a critical interest rate decision on June 18, the inflation data provides welcome justification for maintaining the cautious holding pattern the central bank has adopted. Markets are pricing in a 95% probability that the Bank will hold interest rates steady at 3.75% at Thursday’s meeting.
Yet beneath this moment of inflation relief lies a more complex and troubling reality: the 2.8% reading represents a statistical anomaly in an otherwise deteriorating inflation trajectory. Energy prices, temporarily suppressed by favorable comparisons with a year prior, are set to soar. Geopolitical tensions, while briefly eased by weekend negotiated breakthroughs, remain fundamentally unstable. Growth is slowing to near-stagnation levels (0.7% projected for 2026, the largest downgrade in the OECD’s outlook). And the energy price cap—the policy mechanism that has temporarily suppressed inflation—is scheduled to increase by 13% in the summer, triggering the inflation rebound that everyone knows is coming.
This is inflation relief built on temporary factors and favorable data accounting—a reprieve, not a resolution.
1. THE DATA: BEATING EXPECTATIONS ON BORROWED TIME
1.1 The May Surprise: 2.8% vs. Expected 3.0%
UK inflation held at 2.8% in May, slightly below expectations, official figures showed on Wednesday. Economists polled by Reuters had been expecting the annual inflation rate to rise to 3% in May.
The 0.2 percentage point miss below consensus is meaningful in macroeconomic terms. While it may appear trivial, it represents the difference between a central bank confidently holding rates steady and a central bank facing pressure to begin hiking. Markets immediately repriced expectations: the probability of rate holds strengthened, near-term rate hike expectations receded, and sterling rallied against the dollar.
The key question is whether this miss reflects genuine underlying inflation moderation or merely statistical timing effects and favorable comparisons that will reverse.
1.2 The April Anomaly and March Baseline
Understanding the May data requires understanding the April baseline: April’s 2.8% reading itself represented a dramatic decline from March’s 3.3%.
April’s drop was explicitly attributed to a reduction in the household energy price cap—a policy mechanism through which the UK government limits the maximum rates that household electricity and gas suppliers can charge. The energy price cap was reduced in April, temporarily suppressing household energy costs and therefore suppressing overall inflation.
This reduction was always understood to be temporary. The energy price cap is adjusted quarterly, and the next adjustment—scheduled for summer 2026—is expected to increase rates by 13%, hitting household budgets with a substantial shock.
The pattern is clear: April benefited from favorable energy cap policy; May benefited from favorable base effects (comparing against May 2025, when energy was also somewhat elevated); but summer will bring the energy price cap increase that reverses both of these favorable factors.
1.3 Transport Inflation and Underlying Pressure
Britain’s Office for National Statistics said Wednesday that transport had been the biggest contributor to rising prices in May, partially offset by falling food and non-alcoholic drink prices.
Transport inflation—driven primarily by fuel prices, which reflect global oil and refined petroleum costs—increased sharply in May. This increase would have pushed overall inflation higher but was offset by falling food prices, which had been elevated throughout the early months of 2026.
The transport inflation data signals that the underlying inflation pressure in the UK remains acute. Fuel prices, driven by geopolitical tensions in the Middle East that disrupted petroleum supply, remain elevated and volatile. The temporary offset from falling food prices is expected to fade as agricultural commodity markets stabilize.
2. THE GEOPOLITICAL CONTEXT: WHY ENERGY PRICES HAVE SOARED
2.1 The Weekend Peace Framework: Brief Respite
Over the weekend preceding the Wednesday inflation release, the United States and Iran announced a framework deal to bring their nearly four-month war to an end. The announcement of prospective peace negotiations (though not yet final agreement) immediately eased energy markets: petroleum prices declined, natural gas futures eased, and market volatility subsided.
This easing was immediately reflected in the inflation data release narrative: analysts noted that the weekend breakthrough on Iran negotiations provided hope that any rebound in UK inflation could be short-lived.
However, the peace framework remains preliminary and fragile. Final agreement requires Iranian Supreme Leader approval and technical-level negotiations. The risk remains that negotiations fail and conflict resumes. In such a scenario, energy markets would re-spike and the temporary relief would evaporate.
2.3 Energy as the Binding Constraint
Energy prices fundamentally shape the near-term UK inflation trajectory. The interplay between three factors determines inflation through the remainder of 2026:
- Geopolitical Resolution: If the Iran-US peace framework leads to genuine agreement, Strait of Hormuz reopening, and petroleum market normalization, energy prices will decline and inflation pressure will ease.
- The Energy Price Cap: If the government maintains caps on household energy costs despite wholesale price increases, households are protected but the fiscal cost to government increases. If caps are allowed to rise to market-clearing levels, households face inflation shocks but inflation statistics reflect this.
- Base Effects and Comparisons: As 2026 progresses and we move further from the peak energy price shock of spring 2026, year-over-year inflation comparisons become easier (we’re comparing against prior-year elevated energy costs), creating statistical easing independent of current energy dynamics.
Understanding these three factors is essential to assessing whether May’s 2.8% reading represents genuine inflation moderation or merely temporary statistical timing.
3. THE BANK OF ENGLAND’S DILEMMA: HOLD OR HIKE?
3.1 The June 18 Decision: 95% Probability of No Change
Markets are pricing in a 95% chance that the Bank of England holds rates steady at its next meeting on Thursday, June 18, 2026, keeping the base rate at 3.75%.
This market probability reflects several factors:
- Inflation Slightly Below Target: At 2.8%, inflation is above the Bank’s 2% target but has moderated from the peaks of 2024-2025. The slight miss below consensus expectations provides justification for patience.
- Growth Concerns Overwhelming: The OECD revised UK growth projections downward to just 0.7% in 2026 (down from 1.2% previously), with the Bank itself acknowledging that the UK “faces the biggest hit to growth from the conflict among the G20 advanced economies.” With growth so weak, raising rates seems counterproductive.
- Forward Guidance Uncertainty: The central bank has explicitly stated that future decisions will depend on geopolitical developments. With the Iran-US peace framework still preliminary, the central bank has rationale to wait for greater clarity.
The decision to hold rates appears straightforward. The June 18 decision is expected to maintain status quo.
3.2 The April Hawkish Signal: Implicit Rate Increases Possible
Yet beneath this expected hold lies a more hawkish signal embedded in the Bank’s broader guidance.
On April 30, when the Monetary Policy Committee held rates steady at 3.75%, the voting was notable: 8 members voted for holding rates, while 1 member—itself significant—voted to increase rates to 4%. This near-unanimous support for holding masked disagreement about direction.
More importantly, in its deliberations and forward guidance, the MPC sent a clear message: higher inflation is on the way and higher rates are likely this year. The central bank’s forecast warned that up to six rate increases could be possible in a worst-case scenario, potentially taking interest rates from 3.75% to 5.25% by year-end.
This guidance signals that the April hold (and expected June hold) should not be interpreted as long-term dovishness. Rather, they represent patient waiting for clearer data on energy prices and geopolitical stability. Once clarity emerges—either from falling energy prices reducing inflation, or from continued inflation pressures necessitating rate increases—the central bank is prepared to move decisively.
3.3 The Housing Market Pressure: Mortgage Rate Anxiety
For UK households, the rate decision has acute implications through mortgage markets. Major mortgage lenders including NatWest, Barclays, TSB and Santander have cut fixed mortgage rates in recent weeks, following rapid hikes earlier in 2026.
However, experts warn that these rate cuts may slow or reverse depending on the central bank’s path and energy market developments. For a typical £250,000, 25-year mortgage, the difference between pre-war rates and current rates translates to an increase in monthly repayments of nearly £300—from £1,445.50 to £1,727—an annual increase of £3,380.
Experts are dubbing this increase the consequence of Trump’s global tariff policies combined with Middle East conflict disruptions—reflecting how macroeconomic shocks filter through to household finances.
4. THE OECD DOWNGRADE: GROWTH COLLAPSE AND INFLATION PARADOX
4.1 The Largest Downgrade in Years
The OECD released updated economic forecasts the same morning as UK inflation data, and the conclusions were sobering: the UK economy will expand by just 0.7% in 2026, down from a previous projection of 1.2%—the largest downgrade in its updated outlook.
This represents a fundamental reassessment of UK economic prospects. The prior forecast of 1.2% growth already represented tepid expansion. A revision downward to 0.7% signals near-stagnation: the British economy is barely growing, approaching recession-adjacent levels of expansion.
The OECD attributed this downgrade to “the biggest hit to growth from the conflict among the G20 advanced economies”—meaning that the UK, of all major advanced economies, is most affected by Middle East disruptions and energy price increases.
4.2 Second-Highest Inflation in G7 After US
The OECD also forecasts the headline rate of inflation in the UK to rise to 4% in 2026—the second-highest in the G7 after the United States, which is forecast at higher levels.
This projection is problematic: the OECD is forecasting that UK inflation will reach 4% while UK economic growth is projected at just 0.7%. This is a stagflation scenario—the combination of stagnant growth and rising inflation that is particularly damaging to households and policy makers.
The immediate comparison: eurozone inflation is forecast at lower levels (currently at 3.2% in May 2026), with growth prospects somewhat better. The US faces higher inflation (4.2% in May) but stronger growth expected. The UK faces a uniquely adverse combination: more inflation pressure than Europe but weaker growth.
4.3 The Macro Mismatch: Inflation Rising, Growth Falling
This creates the fundamental policy paradox: traditional economic management would suggest that with growth at 0.7%, the central bank should be cutting rates to stimulate expansion. Yet inflation at 2.8% (and projected to rise toward 4%) suggests that rate increases are needed to contain price pressures.
The Bank of England cannot simultaneously accommodate weak growth and contain elevated inflation. Whatever decision it makes will leave one objective unaccommodated.
5. THE ENERGY PRICE CAP: THE POLICY MECHANISM HOLDING BACK INFLATION
5.1 How the Price Cap Works
The energy price cap is the policy mechanism through which the UK government limits the maximum rates that household electricity and gas suppliers can charge. The cap is adjusted quarterly, with adjustments typically occurring in January, April, July, and October.
In January 2026, the cap stood at levels that kept household energy costs elevated but manageable relative to wholesale price increases. In April 2026, the cap was reduced—a policy decision that temporarily suppressed household energy costs and therefore suppressed inflation.
However, the April reduction was explicitly temporary: the July adjustment is expected to increase the cap by 13%, reflecting elevated wholesale natural gas prices. This 13% increase will hit household budgets with a substantial shock beginning in summer 2026.
5.2 The Policy Trade-off: Inflation Suppression vs. Fiscal Cost
The energy price cap represents a political decision to suppress inflation statistics by preventing wholesale energy price increases from fully transmitting to household bills. The cap keeps the public statistics (CPI inflation) lower than they would otherwise be, but at the cost of:
- Government Fiscal Cost: When wholesale energy prices exceed the capped rates households pay, suppliers incur losses. These losses are absorbed through various fiscal mechanisms, adding to government expenditure.
- Delayed Adjustment: By delaying the full transmission of energy costs to households, the cap postpones the adjustment process. When the cap eventually rises, households face larger shocks.
- Misallocation of Resources: Artificially suppressed energy prices discourage conservation and investment in energy efficiency, potentially worsening long-term energy security.
Policymakers face an explicit trade-off: prevent inflation from being released into CPI statistics (politically popular), or allow prices to rise to market-clearing levels (economically efficient but politically unpopular).
5.3 The Summer Shock: When the Cap Rises
The July 2026 energy price cap increase of 13% will hit households with direct inflationary impact. Analysts project that this single policy change will add approximately 0.4 percentage points to headline inflation, pushing the overall inflation rate from current 2.8% levels toward the 3.2-3.5% range.
This means that the current “brief reprieve from climbing prices” that May’s data represents will be short-lived. The summer energy price cap increase will mechanically push inflation higher in the July-August-September timeframe, regardless of energy market developments or geopolitical outcomes.
6. THE COMPARATIVE CONTEXT: UK INFLATION IN GLOBAL PERSPECTIVE
6.1 Below Eurozone, Well Below US
At 2.8% in May 2026, UK inflation is now notably lower than eurozone inflation (3.2% in May) and significantly lower than US inflation (4.2% in May).
This comparative advantage is notable given the UK’s greater energy vulnerability. The UK imports roughly 50% of natural gas and has limited domestic oil production, making it more exposed to petroleum price increases than other major economies. That UK inflation has remained below US levels despite this vulnerability reflects several factors:
- Energy Price Cap Suppression: The UK’s policy cap on household energy bills has suppressed household inflation statistics relative to what would emerge without the cap.
- Energy Market Structure: UK energy markets, while exposed to global petroleum prices, benefit from diversified supply sources and mature energy trading infrastructure that mitigates some price volatility.
- Domestic Demand Weakness: Weak consumer demand (itself a consequence of economic uncertainty and higher mortgage costs) has suppressed inflationary pressures in non-energy sectors.
6.2 The Growth Problem: Lower Than Peers
Yet while UK inflation has been contained below US levels, UK growth has been materially weaker. The OECD projects:
- UK Growth: 0.7% in 2026
- Eurozone Growth: Higher than UK (exact figure context-dependent)
- US Growth: Higher than UK despite higher inflation
This means that the UK faces a uniquely adverse combination: moderate inflation with very weak growth. This is worse than alternative combinations (high inflation/high growth, low inflation/low growth, or high inflation/strong growth).
7. THE INTEREST RATE PATH: HOLD NOW, HIKES LIKELY LATER
7.1 The Expected June Hold
With May inflation at 2.8% and growth so weak, the June 18 rate hold at 3.75% appears certain. The Bank has rationale to wait:
- Inflation Slightly Below Forecast: The 2.8% reading is slightly better than the 3.0% consensus, providing technical justification for patience.
- Energy Market Stabilization Pending: The Iran-US peace framework, if realized, could stabilize energy markets and ease inflation pressure. Raising rates before this clarity emerges seems premature.
- Growth Concerns Paramount: With growth projected at 0.7%, raising rates risks pushing the economy into recession.
The June 18 decision will almost certainly be a hold.
7.2 The Medium-Term Outlook: Rate Hikes Likely in H2 2026
However, the Bank’s April guidance about “up to six rate increases possible” signals that rate hikes remain likely in the second half of 2026. The path will depend on:
- Energy Price Dynamics: If the Iran deal holds and petroleum prices decline materially, inflation pressure will ease, reducing hike pressure. If geopolitical tensions persist and energy prices remain elevated, rate hikes become more likely.
- Growth Data: If the economy slips into genuine recession (negative growth), rate hike pressure recedes. If growth stabilizes even at weak levels (0.7-1%), inflation concerns may dominate.
- Wage Dynamics: If labor markets tighten and wage growth accelerates, inflationary pressure increases and rate hikes become more likely.
Markets are currently pricing in rate hike probability by year-end, with traders expecting the central bank to hike interest rates by the end of this year.
8. THE HOUSEHOLD PERSPECTIVE: MORTGAGES, RENTS, AND REAL INCOMES
8.1 Mortgage Rate Anxiety
For the 65% of UK households that own their homes with mortgages, interest rate decisions have immediate financial consequences. The £3,380 annual increase in mortgage payments for a typical £250,000, 25-year mortgage represents meaningful real income pressure for most households.
The recent mortgage rate cuts by major lenders provide temporary relief. However, if the Bank of England begins hiking rates in H2 2026 as markets are pricing, mortgage lenders will likely raise rates in response, reversing the recent cuts.
The timing is particularly damaging: households are remortgaging at elevated rates, many are experiencing the first mortgage payments following rate hikes accumulated over the past year, and growth is weak (reducing job security and income prospects).
8.2 Rental Pressure and Cost-of-Living Crisis
Beyond mortgages, UK households face rental market pressure. Rental inflation—the rate of increase in residential rents—has accelerated sharply, with rents rising 10%+ year-over-year in many regions. This reflects landlord responses to rising mortgage costs and the limited supply of rental housing.
For renters (approximately 20% of UK households), the cost-of-living crisis remains acute despite moderating headline inflation. Real incomes (wages adjusted for inflation) have been essentially stagnant since 2019, meaning that households have seen no improvement in purchasing power despite 2026 being six years after the prior peak.
8.3 Stagflation Implications
The combination of weak growth (0.7%) and still-elevated inflation (2.8%, heading toward 4%) implies stagflation—a scenario where households face both limited income growth (consequence of weak economy) and rising prices (consequence of inflation). This is particularly damaging for lower-income households with limited savings and high consumption of essential goods (energy, food, transportation).
9. THE POLITICAL ECONOMY: HOW INFLATION SHAPES GOVERNANCE
9.1 The Labour Government’s Fragile Mandate
The current UK government, led by Labour Prime Minister Keir Starmer, took office in July 2024 after 14 years of Conservative government. The government entered office with a promise to manage inflation, restore economic stability, and improve living standards.
The 2.8% inflation reading provides short-term political relief: the government can claim that inflation is moderating and that its policies are working. However, the broader economic picture—0.7% growth, stagflation risks, mortgage rate increases, rental inflation—suggests that households are experiencing deteriorating living standards despite moderating headline inflation.
The government’s political sustainability will depend on whether real incomes can be restored and whether growth can be revived before the next general election (expected in 2029). Current trajectories suggest that this is unlikely.
9.2 The Tariff Backdrop: Trumpflation and Uncertainty
Underlying these near-term UK inflation and growth dynamics is a deeper uncertainty created by Trump administration tariff policies. The US has imposed substantial tariffs on goods and trading partners, creating broader global trade uncertainty and inflationary pressure.
The term “Trumpflation” has emerged to describe the inflationary impact of US tariffs, which typically increase prices for imported goods. For the UK, which is a substantial importer of US goods and dependent on global trade, Trump tariff policies represent an additional inflationary risk beyond energy prices.
CONCLUSION: RELIEF NOW, CHALLENGES AHEAD
The May 2.8% inflation reading provides temporary relief from the economic pressures that have dominated 2026: the data beat expectations, justifies the Bank of England’s cautious holding pattern, and suggests that headline inflation may stabilize rather than accelerate.
Yet this relief is built on temporary factors: favorable energy price comparisons with a year prior, the April energy price cap reduction, and offset from falling food prices. As summer approaches, multiple factors will work to push inflation higher:
- The July Energy Price Cap Increase: The 13% rise in the cap will directly push inflation toward 3.5% in the third quarter.
- Fading Favorable Comparisons: As 2026 progresses, comparisons against 2025’s elevated energy prices become less favorable from an inflation statistics perspective.
- Persistent Transport Inflation: Fuel prices remain volatile and elevated given geopolitical uncertainties, maintaining pressure on transport inflation.
The Bank of England will likely hold rates on June 18, providing relief for mortgage holders and businesses. However, the central bank’s April guidance about possible rate increases remains operative: once energy and geopolitical clarity emerges, rate hikes in H2 2026 become likely.
For UK households, the current moment represents the high-water mark of the 2026 economic respite. The remainder of the year will bring escalating pressures: higher energy bills, potential rate hikes, weak growth, and eroding real incomes. The moment of inflation relief will prove temporary.
Sources and References
- CNBC – “UK Inflation Holds Steady at 2.8% in May” (June 17, 2026)
- HomeOwners Alliance – “Latest UK Interest Rate Forecasts: Will The Bank Of England Cut Interest Rates On 18 June 2026?” (June 2026)
- CryptoBriefing – “UK Inflation Rate Expected to Rise as May 2026 Figures Loom Over Bank of England Decision” (June 17, 2026)
- HomeOwners Alliance – “Mortgage Rate Predictions 2026: Are Mortgage Rates Going Down?” (June 2026)
- Bank of England – “What Is Happening With Interest Rates in the UK?” (April 30, 2026)
- Euronews – “Bank of England” (Multiple articles through June 2026)
- MarketBeat – “UK Inflation Eases by Less Than Anticipated Ahead of Bank of England Rate Decision” (June 18, 2025 comparable data)
- Business Standard – “UK Inflation Rises 2.2%, Remains Slightly Less Than Expected in July” (2025 comparable analysis)
- Office for National Statistics – “UK Consumer Price Index Data” (June 17, 2026 release)
This article documents UK inflation and monetary policy developments as of June 17, 2026, synthesizing reporting from CNBC, HomeOwners Alliance, Bank of England statements, and other sources covering UK macroeconomic conditions, interest rate decisions, and household financial impacts.
Disclaimer: This article is journalistic analysis based on official government data, central bank statements, and economic reporting as of June 17, 2026. Economic forecasts and interest rate predictions remain subject to rapid change based on evolving geopolitical circumstances, energy market developments, and policy decisions.